Santa was very kind to me this Christmas. Not only did I get some awesome wardrobe updates (I mean, come on, a “Meet the Beetles” t-shirt from National Geographic! And a matching one in a size that Eric will be before I know it!), I also got some geek kit. Santa must have picked up on my frustration when, a couple of months ago, my previously satisfactory rain gauge from Oregon Scientific began blinking and refusing to send rainfall data. This caused me to miss out on some really big rain days in this El Nino-fired wet dry season, including a couple of big rain days in December, one on the 12th, and another a few days later, in the run-up to Christmas. Apparently several other people have experienced this same phenomenon with the Oregon Scientific device, and were dissatisfied with the company’s response, so I didn’t even bother contacting customer service. I decided to move on to bigger and better things, as soon as I could afford to.
And Santa took affordability right out of my personal equation of time. [The actual equation of time correlates apparent and mean solar times (you know, the problem of local noon: the sun is rarely exactly overhead when the clock reads 12:00); my own personal equation of time correlates perceived need, actual need, available funds, and how long I need to wait before I can purchase an item where actual need is quite a bit less than perceived need. Actual need, Na, is a product of perceived need, Np, (a simple multiplier) and bank account balance B; when Na< x (an arbitrarily determined value representing monthly surplus funds), no value of Np is sufficient to move Na above the threshold for purchase. Santa’s elves were able to bypass the Na : x singularity and deliver an ISS to me without needing to do the math at all.] Go, Santa!
Here’s a picture of what Santa brought me:
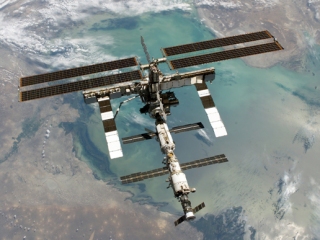
Do you recognize it? That’s OK, not many people would. This contraption is an ISS. No, not an international space station; that looks like this:
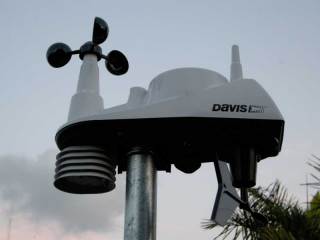
What I have installed on a pole in my back yard is an integrated sensor suite (ISS), a weather monitoring station created by Davis Instruments:
This ISS transmits data wirelessly to a console in my house to show me what’s happening in my little corner of the world. And while the acronym may be the same, the data collected by this ISS probably interest the world somewhat less than the data collected by the other ISS.
But to me, my ISS is a thing of glory. It transmits the data it receives to the Vantage Vue console Santa left under the tree for me, the combination of which (ISS and VV console, not Santa or the Christmas tree) allows me to discover any of dozens of pieces of information about what’s going on in my backyard. Of course it tracks current conditions (wind speed, wind direction, temperature (inside and out), humidity (inside and out), barometric pressure, rainfall, etc.), and records them graphically, keeping track of highs and lows for the day, month, and year. By tracking barometric pressure it gives a 12-hour forecast that so far (a couple of days’ data is all I have) seems pretty accurate. It even shows the phases of the moon, and, in a feature that I have yet to discover for myself but see mentioned on their website, it somehow reports on astronomical data like meteor showers and “seasonal changes,” whatever those might be. (Meteor showers, of course, occur at predictable intervals, so it’s just a calendar-based function, I’m sure.)
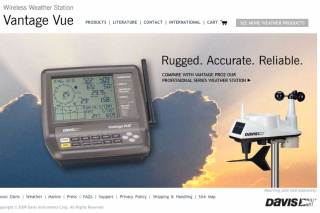
Below is a screenshot from their site, showing the console and the ISS together:
I was so excited about the new gear that the day after Christmas I took the boy and the wife to the home improvement center to get a ten-foot pole (insert obligatory joke about not touching it with a ten-foot pole, hur hur hur) to mount the ISS and begin transmitting data immediately. Had I been a bit more patient, I could have read this review of the device and learned a bit more before I started, but I think I got everything right anyway–as the reviewer says, this really is an easy device to install!
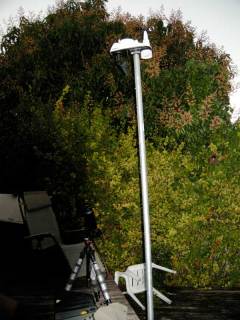
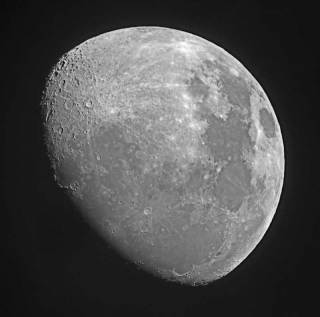
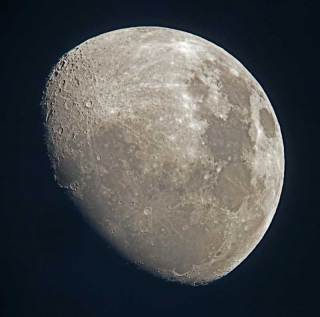
As you can see from the photos at the top of the post, I’ve mounted it right by the deck on which I frequently set up my small refractor for quick solar system viewing. And here are a couple of shots of what I saw on the evening of the 27th as I hung out next to the ISS:
Now, of course, even before I’ve finished figuring out all the features I currently enjoy on my weather station console, I’m bitten by the perceived need bug. What will I do when I’m traveling? How will I know what the weather is like? Well, for a couple hundred more dollars, I can get the device logger that will enable me to download and track the data in a quite sophisticated, but primitively ugly, program called WeatherLink. (Click the link only if you want to see the horrors of Windows 3.1 in this Mac OS world; there is a Mac version of the program, but it looks exactly the same as the Windows one. Shudder…) The reviewer I link to above says that I want the IP version to upload straight to the web, rather than the USB version, so that gives me some food for thought. It also means my values of Np are getting pretty darn high…
Some of these questions might seem pretty trivial, even vain (hence the pun in the title of this post–after all, why do I need to know what the weather is like at home when I’m on vacation, or even on a business trip?), but there are some practical applications for this. For example, rainfall totals here in Florida vary widely at stations just a few miles apart; it’s very possible that rainfall at “Boca Raton” (the airport) would be heavy, while my house would be bone dry. I don’t want to turn my irrigation system off if just because the airport got some rain! (I’m still trying to wean my landscape off of irrigation, but I still have too much turf, and even some of my natives start to really dry out between rains if I leave the sprinklers off. Of course, that’s what rainbarrels are for…)

I ran a very crude weather station for some years, together with a webcam. The Wayback Machine has snapshots of how I integrated the two.
For me, it was very practical because I worked in the plains and if the winter weather really turned bad at home, I needed to leave and get back before my driveway became impassable. In the summer time I also gave the cam’s view a dedicated monitor at work to watch for smoke.
That was a 1-Wire weather station by Dallas Semiconductor BTW. It had just wind and temperature, and neither measurement was terribly accurate from what I could tell, likely because of where I had to install it owing to cable lengths (direct sunlight, but also shielded by the house from wind). The software also sucked. But it logged to a plain text file, so I wrote a little perl CGI script to scrape the latest readings out and put them on the web page.
The most amazing part was that the landlord allowed me to bore a 1/2″ hole through my wall to run the data cables for both camera and weather station.
Do you use wunderground? They have a system for submitting your measurements. See this page for info. I never did that with my station, but there were others in our mountain neighborhood who did.
@Oroboros: Wow, you are ahead of the curve! I’d love to do something like what you’ve done, but I face two issues at the moment: 1. No data logging with the VantageVue, unless and until I pony up the $165 for Davis Instrument’s WeatherLink for Mac (USB cable to a dedicated machine), or for Windows (still USB cable to a dedicated, always-on machine), or $260 for WeatherLinkIP to upload the data wirelessly sans computer. In other words, it’ll be at least $165 before I can log the data. Then I either need 3rd-party software to upload the logged data, or figure out how to send the data myself, which brings up issue number 2: I ain’t no good at computers. I can run blogging software, and operate in web browsers and Micro$oft Office, and whatnot, but while I can parse the grammar of what you said (“write a little perl CGI script”), I wouldn’t have the foggiest notion how to do it myself.
So basically I’m just trying to recover from the fiscal crisis that is Christmas before I get to Stage 1 of weather data sharing (getting the data logging unit). Then it’s on to Stage 2, finding the best way to send it out, both to a widget on my blog and to someplace like Wunderground or CWOP.